
SIDNEY — The Ohio Department of Education (ODE) released it’s 2015-16 School Report Cards Thursday and local districts are both pleased with some of the results and understanding of the difficulty presented in trying to compare the results to previous years.
“We have always done well in our district,” Fort Loramie Superintendent Dan Holland said. “I think that is a combination of outstanding teachers, parents supporting and working with their children at home, community support of our schools, and a Board of Education that supports student learning. With that being said, it’s difficult to even decipher some of the grades we have been assigned because the method to which they have been assigned is not easily decipherable.”
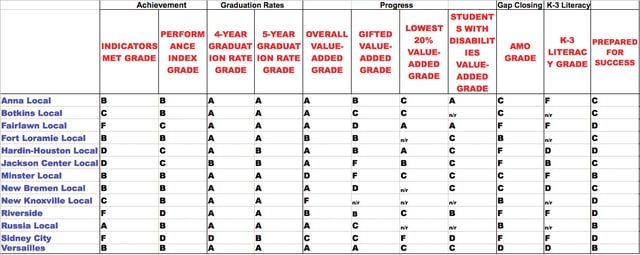
The report cards include six major components – Achievement, Progress, Gap Closing, Graduation Rate, K-3 Literacy and Prepared for Success. There are one or more measures within each component. The state assigns an A to F letter grade to each.
The attached table shows the letter grades for local school districts in all categories and sub-categories. The Indicators Met category answers the question: “How many students passed the state tests?” While the Performance Index category asks: “How well did the students do on the state tests?” The graduation rates cover how many students graduated in four years and five years.
The progress section is the district’s average progress for its students in math and reading, grades four to eight. It looks at how much each student learns in a year. Did students get a year’s worth of growth? Did they get more? Did they get less? It looks at all students, gifted students, lowest 20 percent of students in achievement and students with disabilities.
The gap closing, or annual measurable objectives (AMO), grade measures how the performance of student groups in the district compare to the state goal in reading, math and graduation regardless of income, race, ethnicity or disability.
The K-3 Literacy grade answers the question: “Are more students learning to read in kindergarten through third grade?” The prepared for success category looks at if students are prepared for future opportunities.
The “n/a” in any category means that the sample size was too small for the affected students. Superintendents agree this is usually a good thing.
The report card marks are a tough read for small schools, Jackson Center Superintendent Bill Reichert said.
“When they break down gifted value added or gap closing, there are some schools whose sample size are tiny thus piling a ton of weight on to a small group of kids – not as accurate as a large district. There are even some small schools that escape a grade at all because they don’t fit in the sample. That can be misleading also,” he said.
Russia Superintendent Steven Rose said he thinks several areas of the report are a good measure of student learning such as the number of indicators met and the performance index.
“However other areas such as the k-3 literacy, AMO, and gifted value added are not a good reflection on student’s ability and a schools overall performance,” he said. “Although Russia received a ‘B’ on our Annual Measurable Objectives, 86 percent of the districts in the state received an ‘F’. This is an area I truly think the state needs to adjust in future years.”
The differentiation in tests from year to year and the testing methods is troubling for the districts.
“I have not had a lot of confidence in our state testing since 2009,” Holland said. “The system is in flux and always changing. The tests are always changing, the design of the online system is changing and there is no comfort level with the current development.”
New Knoxville Superintendent Kimberly Waterman said the state has chosen to represent public schools based on measures that she does not agree with along with many superintendents across the state.
“With three different tests in the last three years we have done our best to meet the challenges and we will continue to meet those challenges as they are presented to us. We have been here before and will prove once again that no matter what the State dishes out we will be one of the best,” she said.
Waterman also noted the results they see from the state tests do not change their confidence in their teachers and the learning abilities and preparedness of their students; Holland agreed.
“It is also important to note that a letter grade of ‘C’ on the report card indicates you are achieving and showing gains in all of your students, which is definitely a good thing,” he said.
Fairlawn Superintendent Jeff Hobbs said he finds it amazing schools who were receiving Excellence with Distinction a few years ago are now D or F type districts.
“It is my opinion most of those districts are still doing a great job and the state has moved the mark so far that the expectations are unrealistic. In no way does that mean we don’t think we have room for improvement at Fairlawn. Our administrative team and teaching staff dig into the results trying to better our overall process,” Hobbs said.
With all the issues presented during the 2014-15 testing cycle, including many parents opting their children out from taking the tests, it was no surprise some districts were going to do better this year, but with higher testing standards a lot of grades were not as high as expected.
Hardin-Houston Superintendent Larry Claypool said this year’s assessments were certainly an improvement over the failed PARCC experiment.
“The tests are of course different from those we have been dealing with the last couple of years, so we have mixed feelings, but we’ll take advantage of the report card data and adjust our instruction delivery model to what we find as we drill down into the details of the grades,” Claypool said.
“We know our kids are making tremendous progress each year and that was reflected in the ‘A’ we received in value-added,” Reichert said. “The turmoil at the state in terms of switching testing companies, moving from paper to online, raising and lowering standards depending on grade levels and subject areas and adding various measures to the report card has left the test results less than reliable. For instance, how do they truly measure growth when the tests and testing companies changed and the kids moved from paper to online tests. We need a few years to gauge reliable results.”
New Bremen Superintendent Andrea Townsend is proud of the increase in their performance index score from a ‘C’ to a ‘B’.
“I believe the testing accurately represents what are students know to a point,” she said. “The test are a snapshot in time of student progress and knowledge. The students had new test this year in math and reading which gives us information on student performance based on the new exams.”
Learning from successes and shortcomings proves to be a common theme among the local school districts.
While Sidney City Schools Superintendent John Scheu said they were not as overall pleased with the results, he noted several pockets of excellence in the district.
“We intend to analyze and try to replicate these success stories- such as the overall value added grade of ‘A’ for Northwood Elementary and Sidney Middle School, and ‘B’ grade at Whittier Elementary for performance index,” Scheu said. “We realize we need to put additional emphasis on both curriculum and professional development options for staff. Bridging the achievement gap among the many subgroups of students we serve with the overall student population continues to be an elusive challenge for us.”
Anna Superintendent Andy Bixler said they have already implemented plans for a more aggressive identification process to determine when students need additional intervention, especially in the early grades.
“We are pleased with many of the areas that were reported, but certainly never satisfied. I would expect that we will do nothing but improve from this point, as our focus will continue to be on analyzing all sources of data to ensure we are preparing our students for future success,” Bixler said.
Rose agreed the ultimate goal is student success, no matter what the state reports say from year to year, or the way the students take the tests.
“The key to long term improvement is to not concentrate on test taking strategies but to provide a rigorous curriculum to our students and ensure that every student finds success.”

